Why do we use Logistics & Warehousing assumptions?
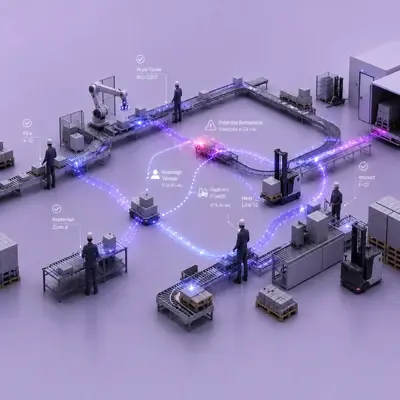
Labor accounts for 50–70% of distribution-center operating cost (CognitOps), and the largest slice of that base is consumed in order picking, where travel alone represents roughly 55% of pick time (de Koster et al., EJOR). At the same time, the stock record drifts systematically away from the shelf — a landmark study of ~370,000 records found 65% of them inaccurate (DeHoratius & Raman, Management Science). At the outbound dock, truck detention, mis-shipments and retailer chargebacks form a further cost layer that most sites never measure. TIM addresses these losses from the worker's hand: the AXION wearable terminal captures every scan, and the KINETIC software layer adds scan-gated verification, flow visibility and evidence capture without touching your existing WMS/ERP (zero-integration level L1). The four operations below build a conservative impact range from sourced industry benchmarks; final figures should be validated against your own baseline.
Why do we use Manufacturing assumptions?
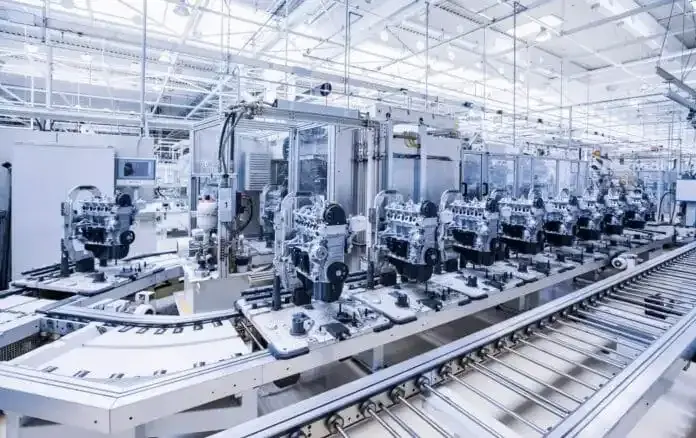
In manufacturing, losses accumulate in small, repeated gaps rather than in a single large failure: rework, scrap, line stops and material searches. Industry benchmarks put the cost of poor quality at 10-30% of revenue for the average manufacturer, against under 5% at world-class plants. Add annual workforce turnover of up to 28% and industrial labor costs in Türkiye rising more than 40% year on year, and shop-floor productivity becomes a balance-sheet issue. TIM's approach is to make the operator interaction the event source: the AXION wearable terminal captures every transaction on the floor, and the KINETIC software layer is designed to convert those records into measurable savings. This report presents a conservative impact range for the four operations with the highest economic weight — assembly, quality control, machining and line feeding — computed from your own baseline.
Why do we use Retail & E-Commerce assumptions?
In retail and e-commerce, profitability depends on hitting fulfillment speed and accuracy simultaneously under tight delivery promises. Order picking alone accounts for 50-65% of warehouse operating cost (Onward Robotics), inventory distortion costs global retail roughly $1.73 trillion a year (IHL 2025), and average store-level inventory record accuracy sits near 65% (Auburn University RFID Lab). The losses accumulate in travel time, mispicks, off-shelf availability and the unmeasured cost of store-fulfilled orders. TIM converts this operational reality into data through the AXION wearable terminal and the KINETIC software layer — without touching your existing WMS/ERP/OMS, which remains the system of record.
Why do we use Automotive assumptions?
In automotive, small execution errors are multiplied by line speed: an unplanned stoppage averages roughly $22,000 per minute across the industry (Thomasnet/ATS survey), and global automakers paid $57.9 billion in warranty claims in 2024 (Warranty Week). Türkiye builds over 1.4 million vehicles a year and exports around 75% of them (Invest in Türkiye; OSD), which places EU-grade traceability and documentation obligations on every plant. TIM transforms the operation from the operator's hands: with the AXION wearable terminal already on the floor, the KINETIC software layer brings scan-gated verification, per-VIN evidence chains and plan-versus-actual visibility without touching your existing MES/ERP. Automotive is TIM's strongest published vertical, with 11 public case studies including Toyota, Mercedes-Benz, Ford, Stellantis, Renault and TOGG.
Why do we use Fast-Moving Consumer Goods (FMCG) assumptions?
FMCG operations must move high volumes across a wide SKU range while holding shelf-life and lot discipline — and retailer contracts put a price on every failure. Order picking alone absorbs 50-65% of warehouse operating cost, shrinkage runs 2-3% of net sales, and compliance chargebacks can consume 2-10% of total revenue. Turkey's 27% minimum-wage increase for 2026 has raised the cost of every labor minute in this picture. TIM KINETIC enters from the worker's hands: because every scan already passes through the TIM wearable, verification, FEFO discipline and operational visibility go live without touching your existing WMS/ERP — your system remains the system of record.
Why do we use Cargo & Delivery assumptions?
Parcel networks run on a hard clock: trailers in, every parcel identified and re-routed, trailers out before cut-off — and every failure of the automated path lands in a worker's hands. The cost structure concentrates accordingly: last-mile has grown to 53% of total shipping cost, with labor at 50–60% of that base; manual sortation missorts run at 4–6% versus roughly 0.1% on automated lines. In this operation every touch is already a scan, which is precisely TIM's leverage point: verification, evidence and flow telemetry from the AXION device already in the worker's hand — live at zero-integration level L1, without touching your existing WMS/ERP. The four operations below represent the industry's heaviest sourced loss pools; all external benchmarks are cited and are never TIM customer results.
Why do we use Construction assumptions?
Across more than 16,000 projects analyzed by McKinsey, only 8.5% met both cost and schedule targets. Rework consumes 4–12% of project value, 11–15% of field labor cost is spent on wasted work, and up to 30% of material delivered to site is never installed. In Turkey, construction input costs rose roughly 5.3-fold between 2019 and 2023 (INTES), turning every wasted pallet into a margin event. The root cause is shared: field reality is never objectively captured at the point of work. TIM KINETIC is designed to start that visibility from the rugged hardware already in workers' hands — without touching your existing ERP or WMS, and without an integration project.
Why do we use Aviation assumptions?
Aviation's frontline layer — the ramp, line maintenance, baggage and the hangar — is the industry's most sensor-poor, most tightly time-boxed set of operations: documentation trails physical reality, and visibility breaks at every custody hand-off. A block minute averaged $100.76 in the U.S. in 2024 (Airlines for America), while baggage mishandling cost the industry $6.3 billion in 2025 — roughly 15% of industry profit (SITA). TIM captures ground truth from the worker's hand via the AXION device at connection level L1: your DCS, BRS and maintenance systems keep running untouched and remain the system of record, with integration as the post-value upgrade. TIM has no published aviation case study yet; every line in this report is a capability claim or an external, sourced benchmark. The same hardware-plus-scan-discipline stack does carry published results in logistics and manufacturing (TIM's own metrics, not independently verified) — fair to weigh as adjacent-industry evidence, never as aviation proof.





 100% accuracy · zero errors
 +43% productivity
 30% savings